Institutional Data
Institutional Effectiveness Data | Instructional Program Review Data | Benchmark Institutions Data
Student Success and Achievement
Skagit Valley College (SVC) collects and analyzes data on key, measurable indicators of student access and achievement, including enrollments, retention, and completion. Data is also disaggregated by demographics such as race, gender, age group, first-generation status, and income to inform efforts and initiatives aimed at closing equity gaps in access and achievement. Additionally, we identify regional and national benchmark institutions to compare SVC’s performance with that of peer institutions. Data presented on this page are grouped into three categories: institutional effectiveness, instructional program review, and benchmark institution data.
Data for Institutional Effectiveness
The Office of Institutional Research maintains multiple dashboards that provide timely and relevant data for both formative and summative institutional self-assessment. The interactive data dashboards listed below are utilized by faculty, staff, and administrators to monitor key indicators of institutional effectiveness. All of the data presented below are disaggregated by various demographics parameters, offering insights for resource allocation, operational planning, and potential interventions designed to address equity gaps as well as to support overall institutional improvement.
| Enrollment Data | Retention Data |
|
|
| Completion Data | Learning Outcomes Data |
| Student Satisfaction Data | Financial Aid Data |
| Campus Climate Data | Institutional Performance Reports |
Data for Instructional Program Review
Access
- Table 1: Program Enrollments, FTES by Program.
- Table 2: Program Demographics, and Headcount.
Achievement
- Table 3: Program, College Level Math/English 101 Attempt and Completion Rates.
- Table 4: Pre-College to College Transition Rates.
- Table 5: Program Retention Rates.
- Table 6: 3Year Completion Rates.
Learning
- Table 7 and 8: Learning Outcomes Data
Satisfaction
- Table 9: Student Satisfaction by academic program (Ruffalo Noel Levitz 2024)
- Table 10: Course Level Student Satisfaction
Data for Benchmark Institutions
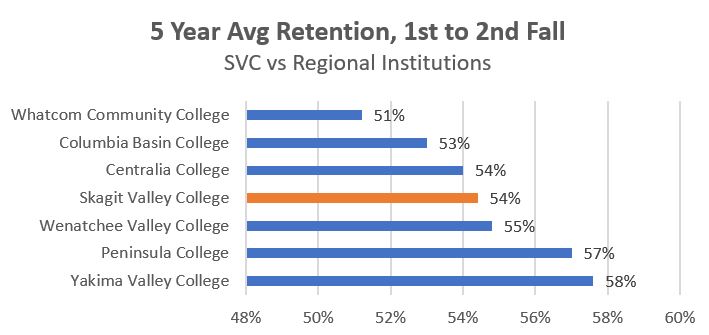
- Regional Benchmark Institutions: The Washington State Board for Community and Technical Colleges (SBCTC) manages ctcLink,
a centralized system used by all 34 colleges in the state to oversee student enrollment,
academic records, financial aid, billing, and more. SVC uses dashboards provided by
the SBCTC to benchmark our performance against regional peers on metrics such as retention,
completion, and post-college employment earnings. The criteria used to select regional
benchmark institutions include: degree-granting four-year colleges, primarily offering
associate’s degrees, public institutions located in similar regions (rural or suburban).
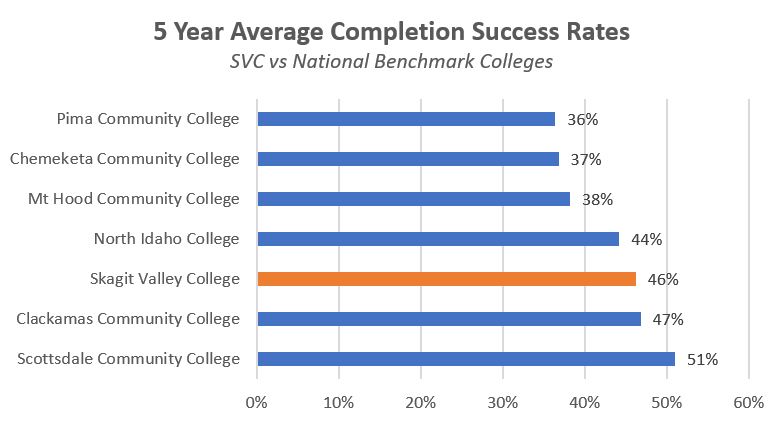
- National Benchmark Institutions: In accordance with U.S. Department of Education requirements, colleges periodically complete the Integrated Postsecondary Education Data System (IPEDS) surveys, which collect data on various metrics, including student retention, graduation and transfer rates. SVC uses data from IPEDS to compare its performance with that of national peers. The criteria used to select national benchmark institutions include: public institutions primarily offering associate’s degrees, located in rural or suburban areas, and participating in Title IV federal financial aid programs.
| Identified Regional Benchmark Institutions | Performance Data |
|
|
| Identified National Benchmark Institutions | Performance Data |
|
 |
 |